こんにちは。数IIIやってると頻繁に出てくるグラフってあるんです。ですから, ある程度記憶しておくと便利かなと思って書いておきます。今回はその対数関数編です。
![]() のグラフ
のグラフ![]() とおくと,
とおくと, ![]()
![]()
![]() とすると,
とすると, ![]() である。
である。
これらをもとにグラフを描くと, 以下のようになる。
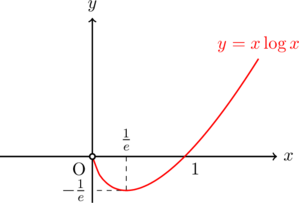
極値に関して
極大値なし
変曲点なし
漸近線なし
![]() のグラフ
のグラフ![]() とおくと,
とおくと, ![]() なので,
なので, ![]()
![]()
![]() とすると,
とすると, ![]() ,
, ![]() とすると,
とすると, ![]() である。
である。
これらをもとにグラフを描くと, 以下のようになる。
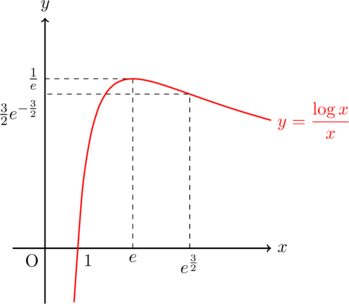
極値に関して
極小値なし
変曲点
漸近線
![]() のグラフ
のグラフ![]() とおくと,
とおくと, ![]() なので,
なので, ![]()
![]()
![]() とすると,
とすると, ![]()
![]() とすると,
とすると, ![]()
これらをもとにグラフを描くと, 以下のようになる。(描画の都合上極値などが示せていない)
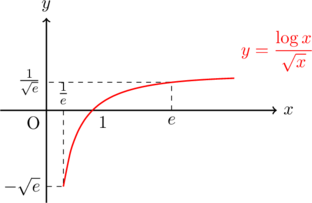
極値に関して
極小値なし
変曲点
漸近線
![]() のグラフ
のグラフ![]() とおくと,
とおくと, ![]() なので,
なので, ![]()
![]() は略
は略![]() とすると,
とすると, ![]()
これらをもとにグラフを描くと, 以下のようになる。(描画の都合上極大値が示せていない)
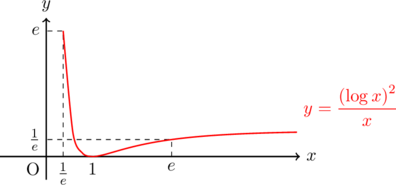
極値に関して
変曲点はあるが特に覚えなくてよい。
漸近線
![]() のグラフ
のグラフ![]() とおくと,
とおくと, ![]() なので,
なので, ![]()
![]() は略
は略![]() とすると,
とすると, ![]()
これらをもとにグラフを描くと, 以下のようになる。(描画の都合上極大値が示せていない)
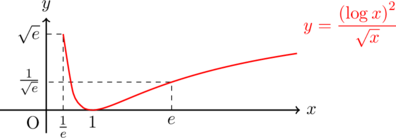
変曲点はあるが特に覚えなくてよい。
漸近線
![]() のグラフ
のグラフ![]() とおくと,
とおくと, ![]() なので,
なので, ![]()
![]()
![]() とすると,
とすると, ![]()
![]() とすると,
とすると, ![]()
これらをもとにグラフを描くと, 以下のようになる。
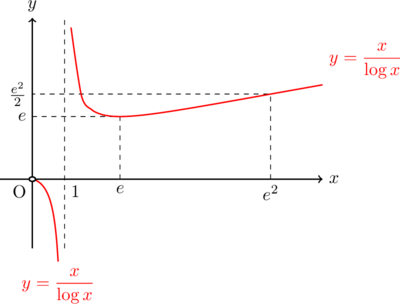
極値に関して
極大値はなし。
変曲点
漸近線
ちなみに
 数樂管理人のブログ

