こんにちは。数IIIの極限のところで出てくる有名な公式です。これまた有名な証明方法で示していきましょう。最後にグラフの概形を載せています。
公式
以下の図形を用いて証明を行っていきます。それぞれの図形は, 頂角が
, 2辺が1の二等辺三角形,
扇形半径1,中心角
,
直角を挟む2辺が,
の直角三角形
となっており, これらの大小関係を不等式で表して, 極限をとっていきます。
上の図において, 面積の関係から下の不等式が成立する。
![Rendered by QuickLaTeX.com \bigtriangleup{\mathrm{OAC}}<](https://mathtext.info/blog/wordpress/wp-content/ql-cache/quicklatex.com-940bad06aa7ee4d60083237892ebdc3a_l3.png)
![Rendered by QuickLaTeX.com \bigtriangleup{\mathrm{OAC}}<\bigtriangleup{\mathrm{OAB}}](https://mathtext.info/blog/wordpress/wp-content/ql-cache/quicklatex.com-baec160412e4466931147f0ad78b4fac_l3.png)
ここで, それぞれ面積を求めると,
![Rendered by QuickLaTeX.com \bigtriangleup{\mathrm{OAC}}=\dfrac12\cdot1\cdot1\cdot\sin x=\dfrac12\sin x](https://mathtext.info/blog/wordpress/wp-content/ql-cache/quicklatex.com-a8909dcbb03dc91cd9be70b60c70946f_l3.png)
扇形
![Rendered by QuickLaTeX.com \mathrm{OAC}=\dfrac12\cdot1^2\cdot x=\dfrac12 x](https://mathtext.info/blog/wordpress/wp-content/ql-cache/quicklatex.com-65446f47c68980d98fd160b9437a89f9_l3.png)
![Rendered by QuickLaTeX.com \bigtriangleup{\mathrm{OAB}}=\dfrac12\cdot1\cdot\tan x=\dfrac12\tan x](https://mathtext.info/blog/wordpress/wp-content/ql-cache/quicklatex.com-1b9a7f2a6dc469586d00e4cfec80a056_l3.png)
よって, 先の不等式にこれらを代入すると,
![Rendered by QuickLaTeX.com \dfrac12\sin x<\dfrac12 x<\dfrac12\tan x](https://mathtext.info/blog/wordpress/wp-content/ql-cache/quicklatex.com-2bfd957e02e5d4ac611c7dfcb560e5c0_l3.png)
![Rendered by QuickLaTeX.com \sin x<x<\tan x](https://mathtext.info/blog/wordpress/wp-content/ql-cache/quicklatex.com-5bdcf5af8151f448ed48fe16914bc8fd_l3.png)
![Rendered by QuickLaTeX.com \sin x< x <\dfrac{\sin x}{\cos x}](https://mathtext.info/blog/wordpress/wp-content/ql-cache/quicklatex.com-2639558a9daa0401950cff9760a0e6c7_l3.png)
辺々を
![Rendered by QuickLaTeX.com \sin x](https://mathtext.info/blog/wordpress/wp-content/ql-cache/quicklatex.com-83376fe5b9be200d8335f3ca7c2c294e_l3.png)
![Rendered by QuickLaTeX.com 1<\dfrac{x}{\sin x}<\dfrac{1}{\cos x}](https://mathtext.info/blog/wordpress/wp-content/ql-cache/quicklatex.com-0a0f02b485bc6590710be35169975783_l3.png)
辺々の逆数をとると,
![Rendered by QuickLaTeX.com \cos x<\dfrac{\sin x}{x}<1](https://mathtext.info/blog/wordpress/wp-content/ql-cache/quicklatex.com-25543f3bb741bf2dcbb9b0ca9039a002_l3.png)
ここで,
![Rendered by QuickLaTeX.com \displaystyle\lim_{x\to+0}\cos x<\displaystyle\lim_{x\to+0}\dfrac{\sin x}{x}<1](https://mathtext.info/blog/wordpress/wp-content/ql-cache/quicklatex.com-976d98e3f3eb528918f18c47771f6350_l3.png)
とすると,
![Rendered by QuickLaTeX.com \displaystyle\lim_{x\to+0}\cos x=1](https://mathtext.info/blog/wordpress/wp-content/ql-cache/quicklatex.com-7304b395ffc5181ca6d89120b5dd61d7_l3.png)
![Rendered by QuickLaTeX.com \displaystyle\lim_{x\to+0}\dfrac{\sin x}{x}=1](https://mathtext.info/blog/wordpress/wp-content/ql-cache/quicklatex.com-e8e4a63cb0a9479e9135af18b73340cb_l3.png)
また,
![Rendered by QuickLaTeX.com \dfrac{\sin x}{x}=\dfrac{\sin(-x)}{-x}](https://mathtext.info/blog/wordpress/wp-content/ql-cache/quicklatex.com-15897d7b6e69fed8913e461c5b851ab9_l3.png)
![Rendered by QuickLaTeX.com \displaystyle\lim_{x\to-0}\dfrac{\sin x}{x}=1](https://mathtext.info/blog/wordpress/wp-content/ql-cache/quicklatex.com-e19b5e7a8450706b9faaf6636951d171_l3.png)
以上より,
![Rendered by QuickLaTeX.com \displaystyle \lim_{x\to0}\dfrac{\sin x}{x}=1](https://mathtext.info/blog/wordpress/wp-content/ql-cache/quicklatex.com-afdab9d03c488c806cc3974dfc9e240a_l3.png)
が成り立つ。
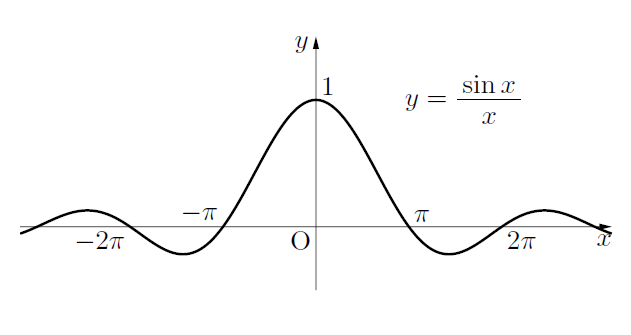
のグラフの概形は以下のようになります。試験ではほとんど出てきませんので, 参考までに。大学で学ぶフーリエ変換とかのところでよく出てくるかもしれませんね?グラフはemathで描きました。縦軸と横軸のスケールは変更しています。